Observability With Influxdb Cloud in 3 Steps
In this post let see how we can do Observability using InfluxDB Cloud. For this experiment we are going to use Two x86 and One ARM system.
As a SRE after setting up my Mini Home DataCenter, my first priority is to set up monitoring and have Eyes on my InfraStructure and Services.
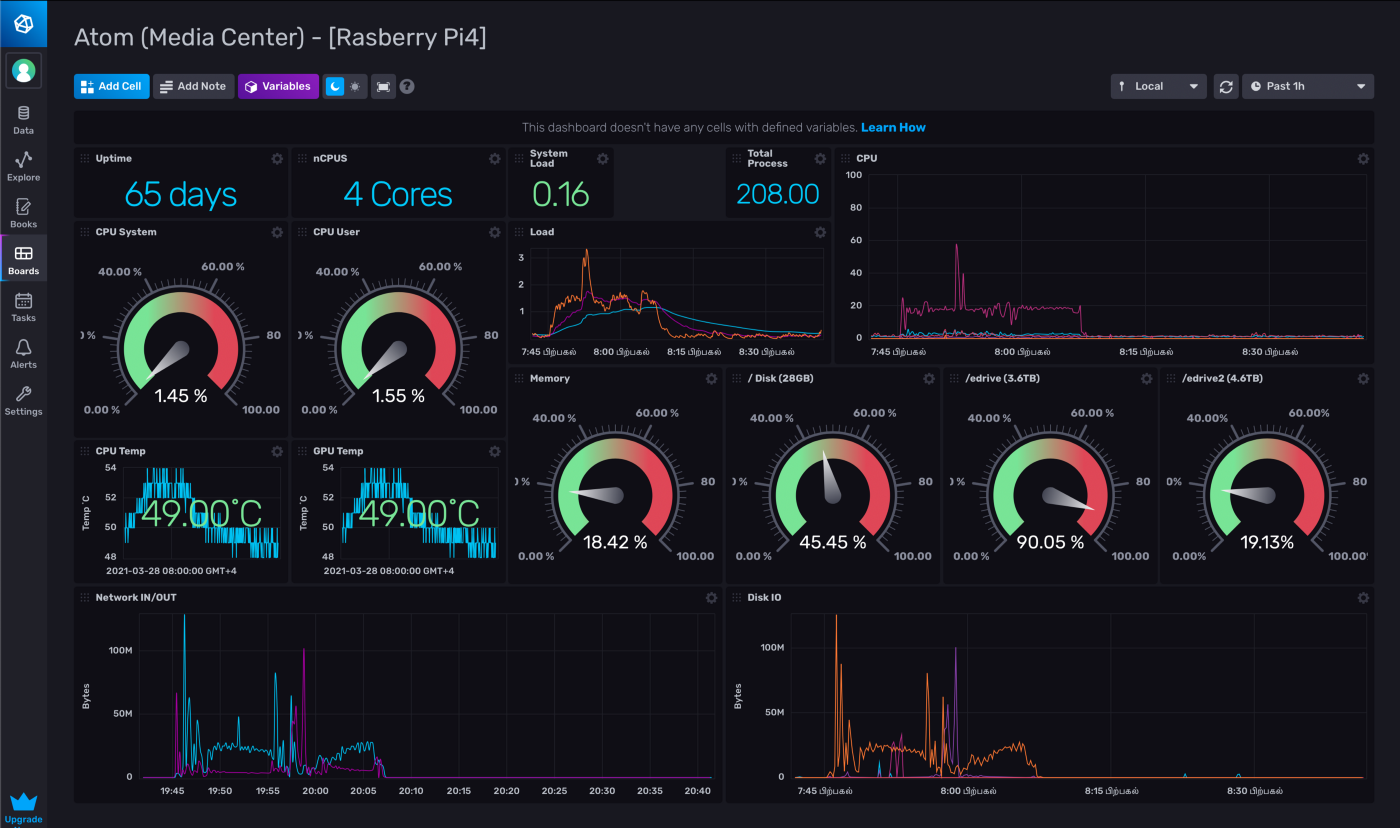
My customised Observability Dashboard
Infra
For x86 we have choosen:
2 x emini NUC Mini PC
Compute : i7 8th Gen 8750H (6 Core), 9M Cache, 2.2GHz upto 4.1GHz Turbo
Memory : 16GB RAM
Storage : 1 TB HDD, 1TB Software RAID1 (2 SanDisk Portable SSD USB3)
For ARM we have chosen:
1 x Raspberry Pi 4
Compute : Quad core Cortex-A72 (ARM v8) 64-bit SoC @ 1.5GHz
Memory : 4GB RAM
Storage : 32B MicroSD, 5TB Segate Portable HDD, 4TB Segate Portale HDD
You can find a more detailed info of this setup in my another post => Building a Micro DataCenter at Home
InfluxDB Cloud 2.0
InfluxDB is a scalable time series database from https://www.influxdata.com. We are going to use their cloud option. We are going with free tier which allows write of 5MB/5 minutes and query of 300MB/4 minutes which is more that enough for our HomeLab setup.
Step 1 : Sign Up
Sign up for the Influx Cloud 2.0 Free account here => Influx Cloud Get Started
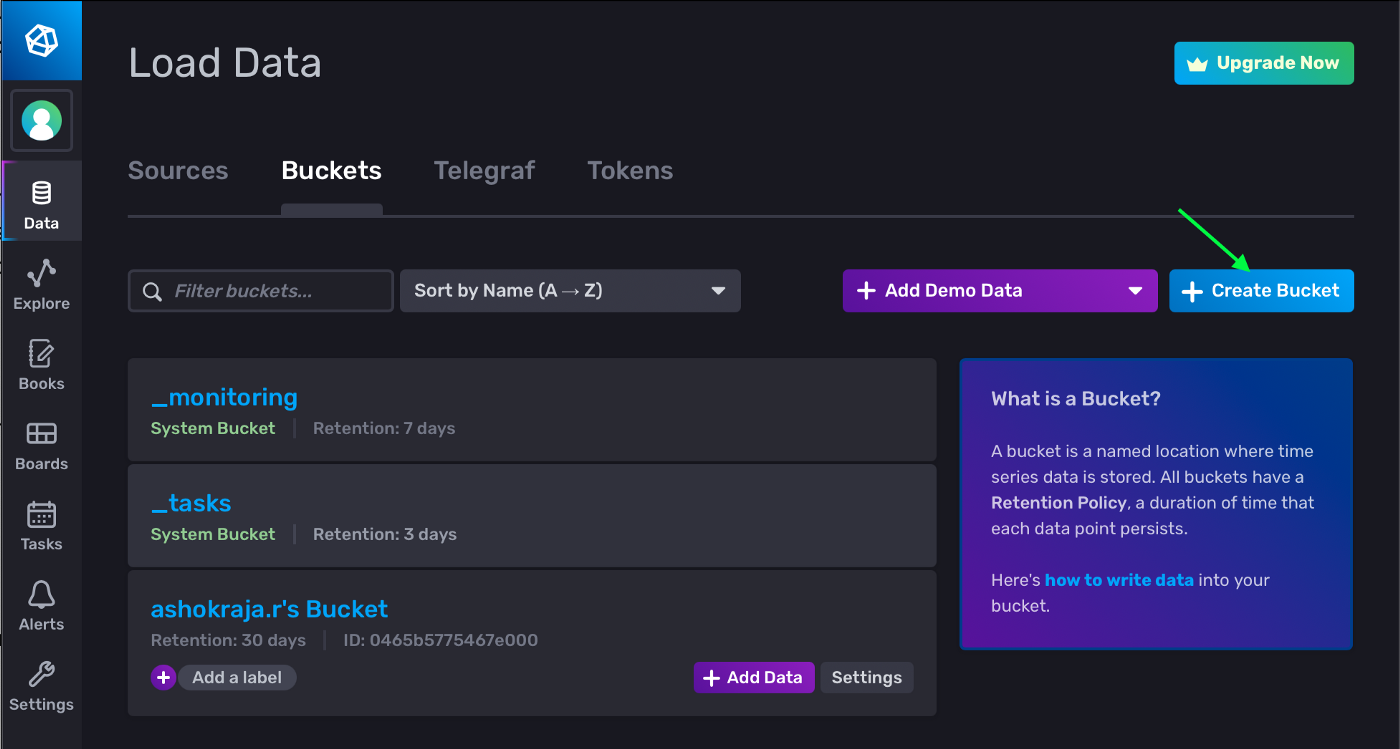
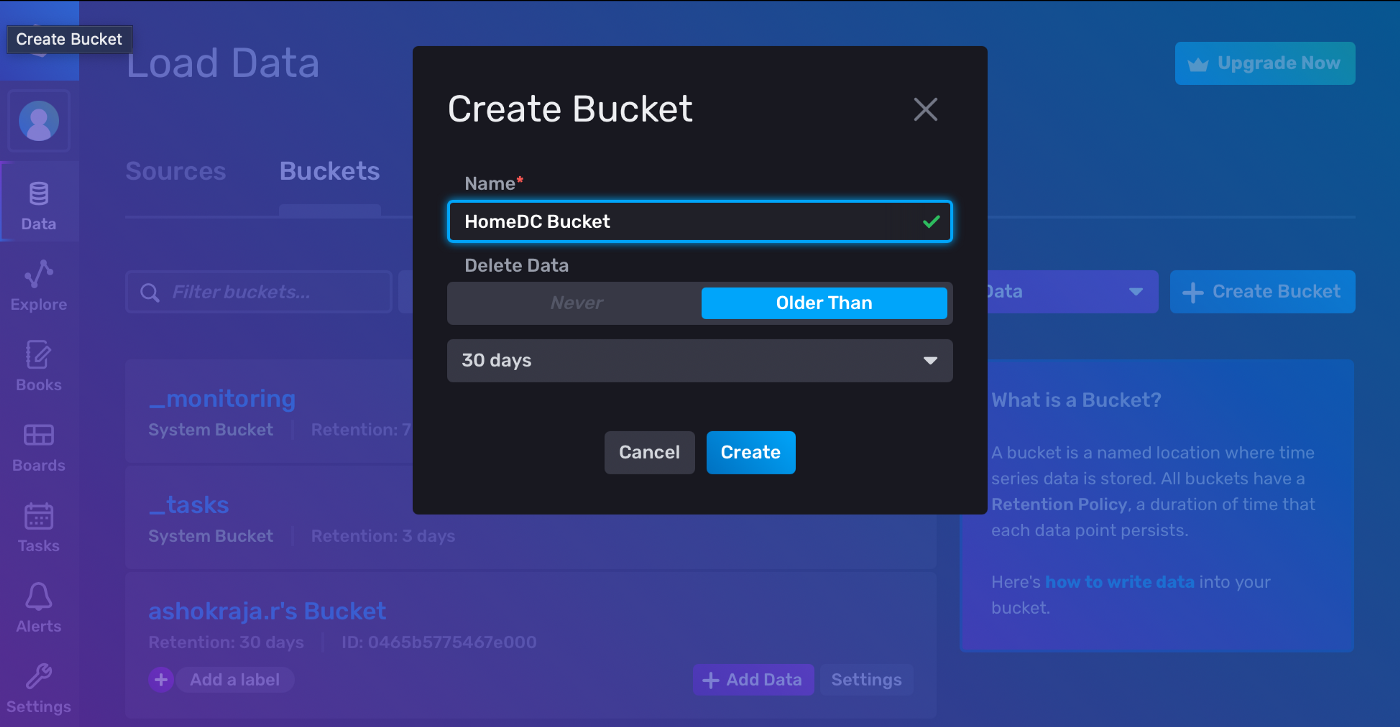
Create a Bucket
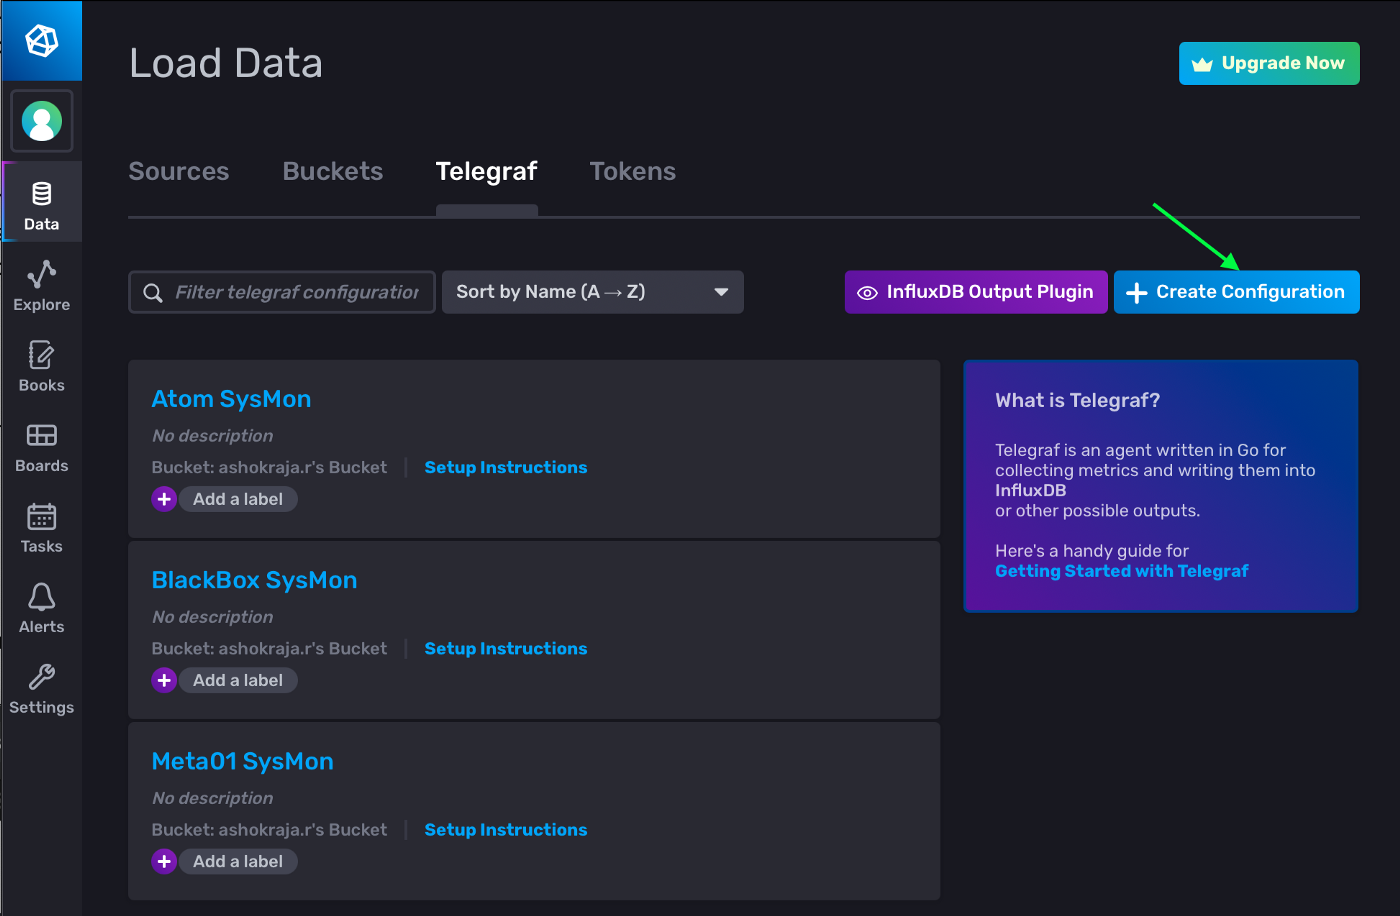
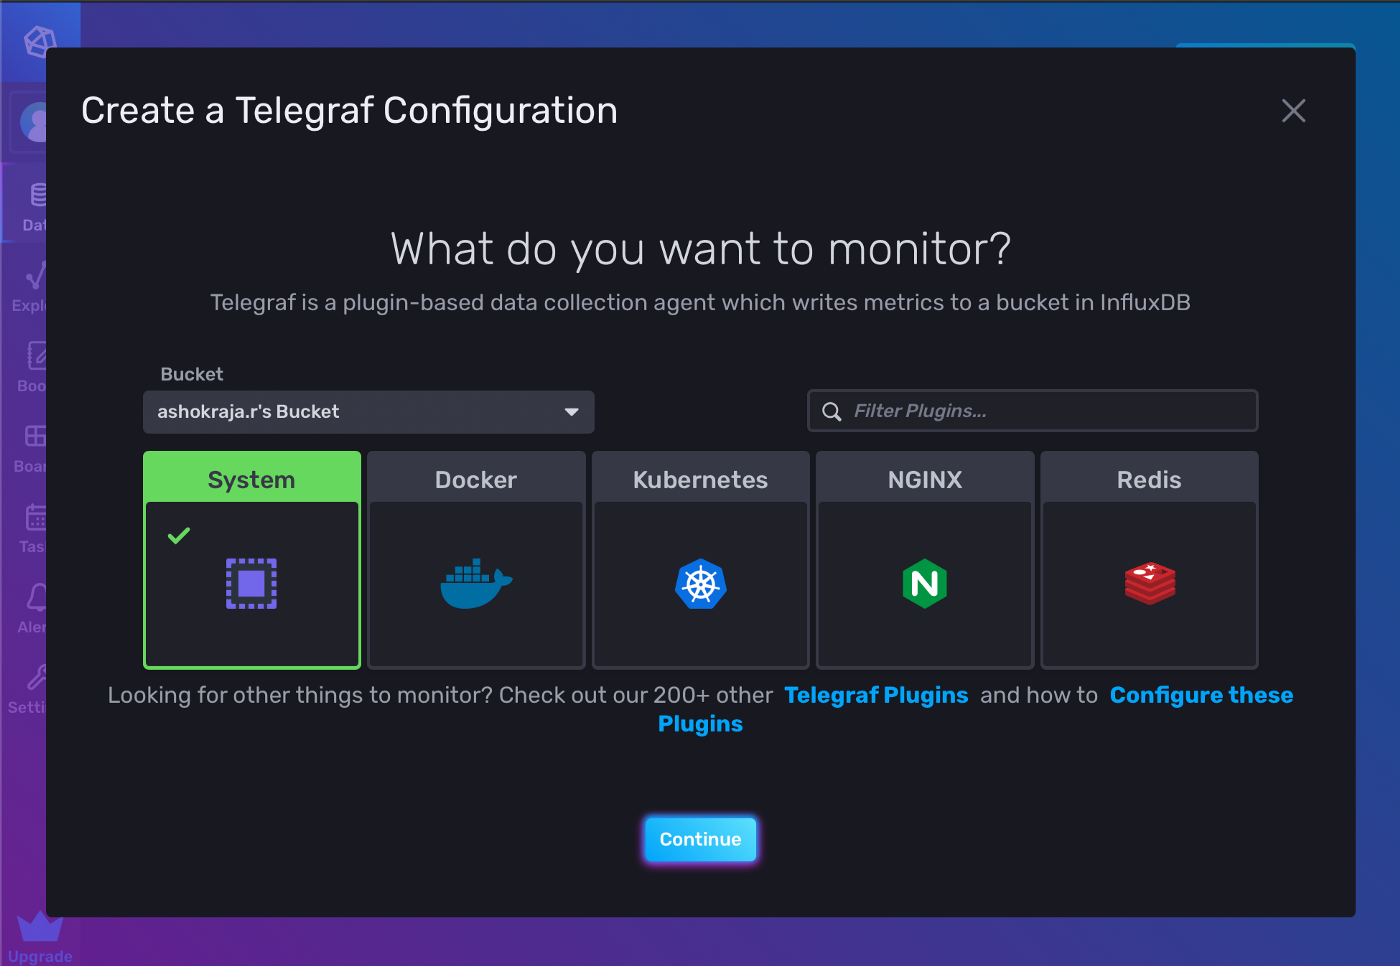
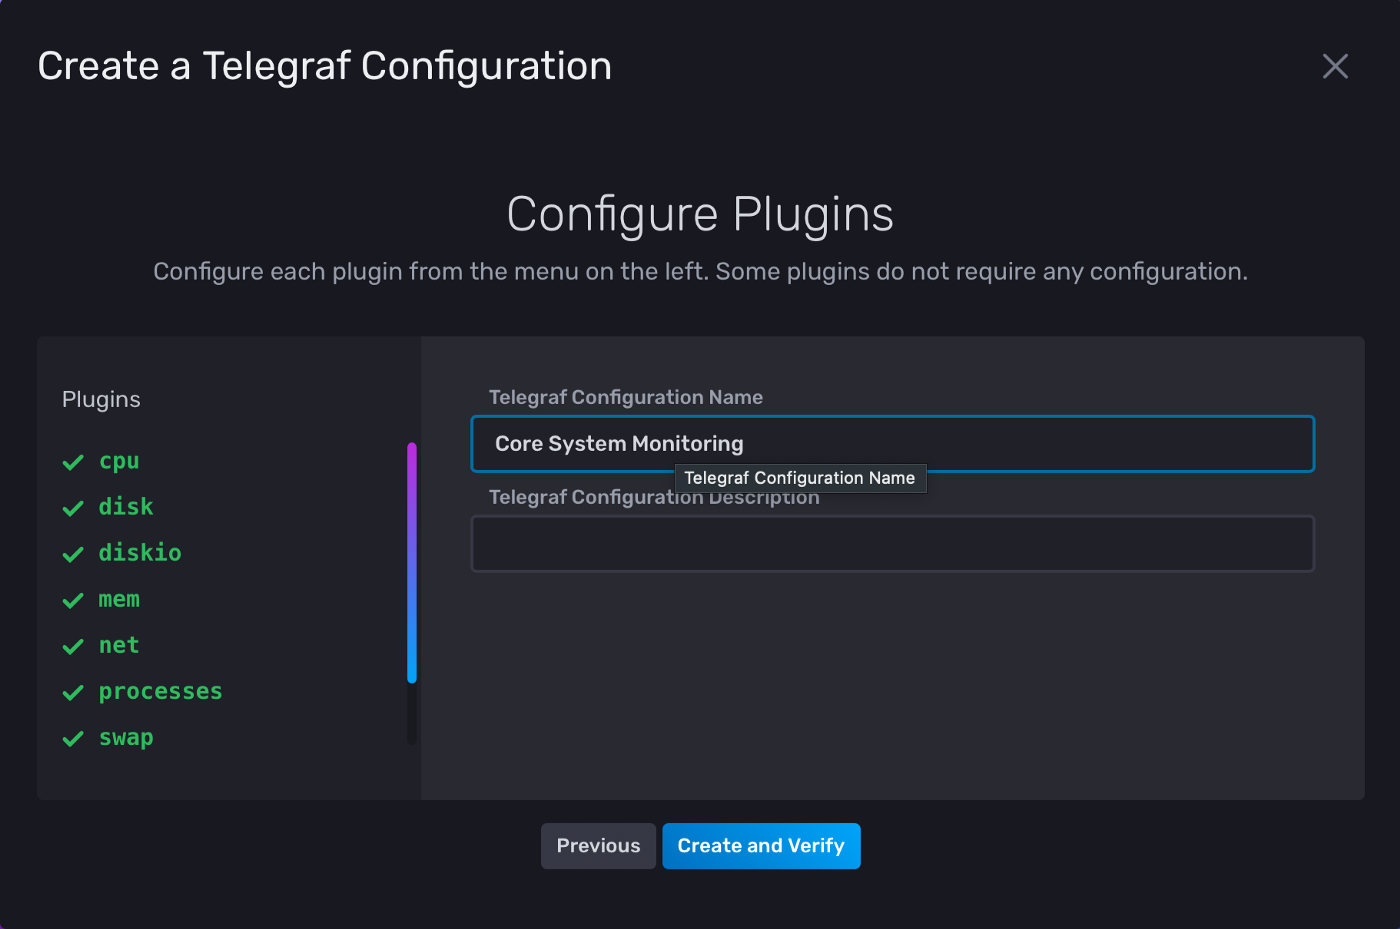
Create Agent Config and Generate an API Token
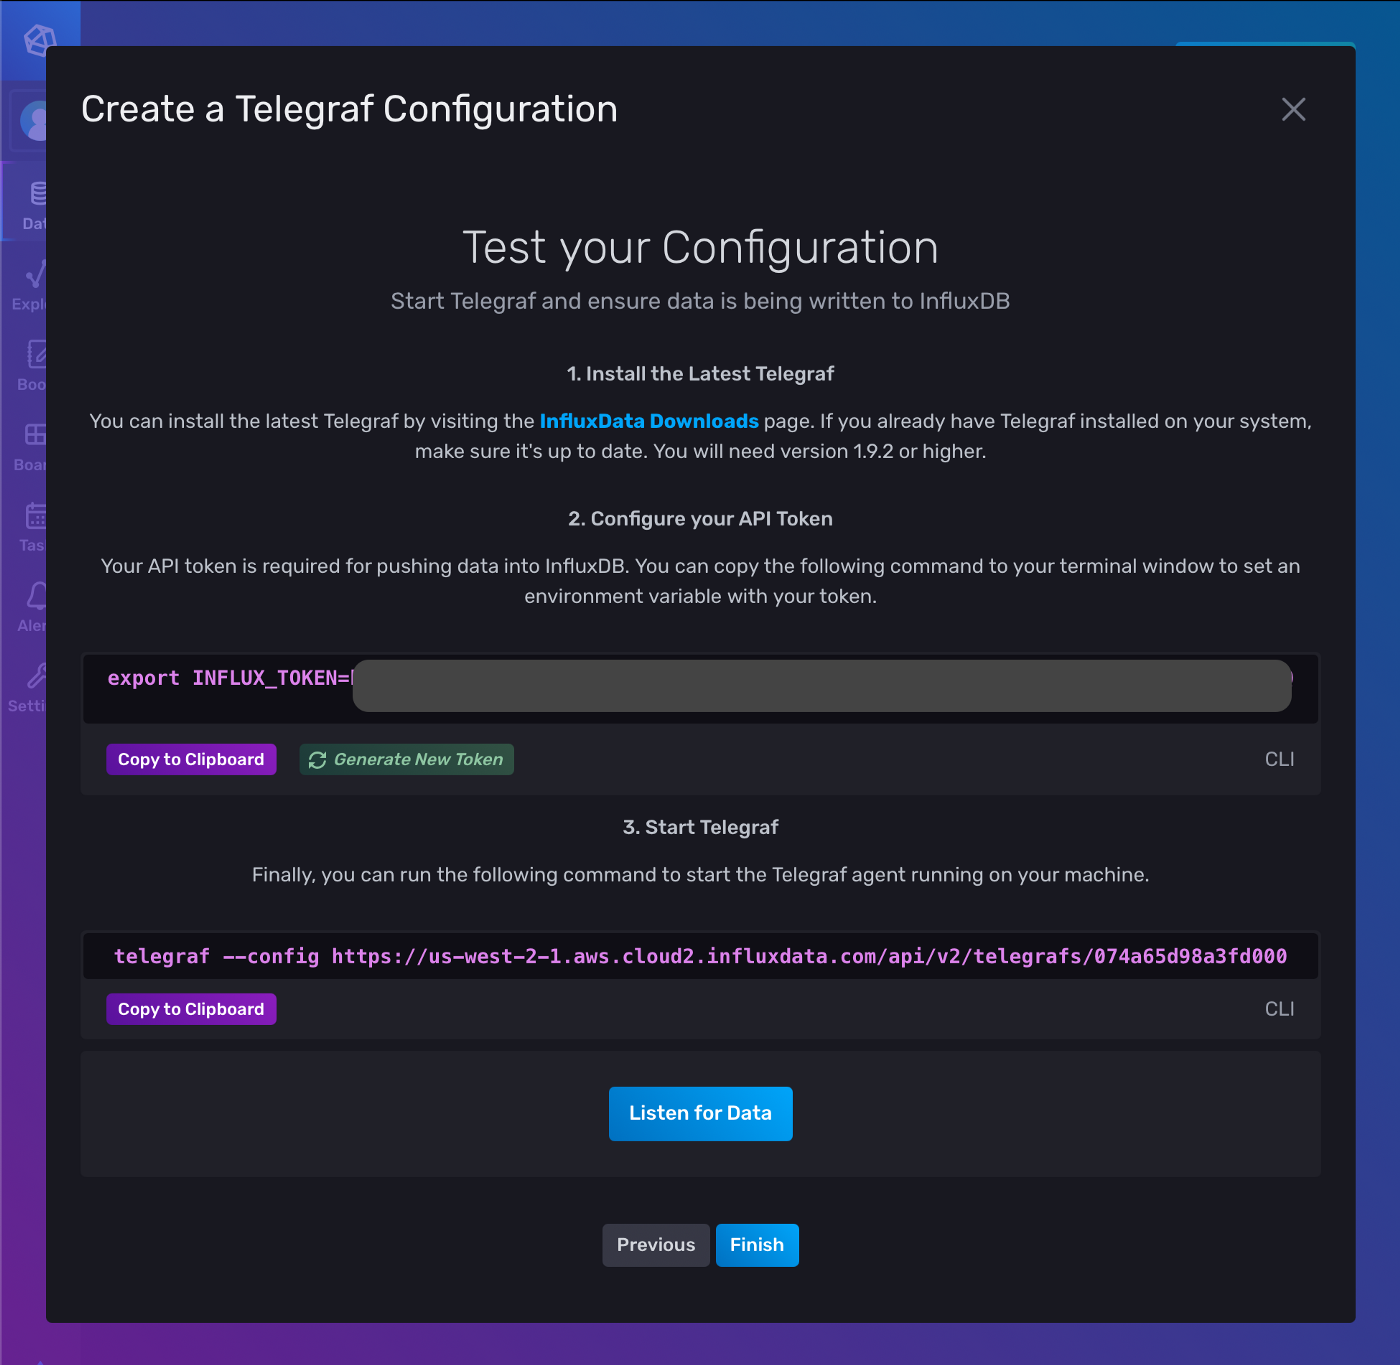
Copy the token and keep it handy for Step-3.
Open the configuration URL which in my case is : https://us-west-2-1.aws.cloud2.influxdata.com/api/v2/telegrafs/074a65d98a3fd000. It will prompt you to download.
Rename the download file from 074a65d98a3fd000 → telegraf.toml
Copy the telegraf.toml to all the machine using SCP or a any other method of your choice.
Step 2 : Install the Telegraf Agent
Telegraf is an agent written in Go for collecting metrics and writing them into InfluxDBor other possible outputs.
There are native installation methods available for most of the popular Operating Systems like, Ubuntu/Debain, RHEL/Centos, Suse, BSD, Mac and Windows.
But, for this post we are going to install telegraf from a Binary Release.
Installing on a x86 Linux
All the steps are run as root user
shell # wget https://dl.influxdata.com/telegraf/releases/telegraf-1.18.0_linux_amd64.tar.gz
tar xf telegraf-1.18.0_linux_amd64.tar.gz

shell # cd telegraf-1.18.0

shell # mv usr/bin/telegraf /usr/bin/telegraf

shell # mv usr/lib/telegraf/scripts/telegraf.service /etc/systemd/system/telegraf.service

shell # systemctl daemon-reload

shell # mkdir /etc/telegraf
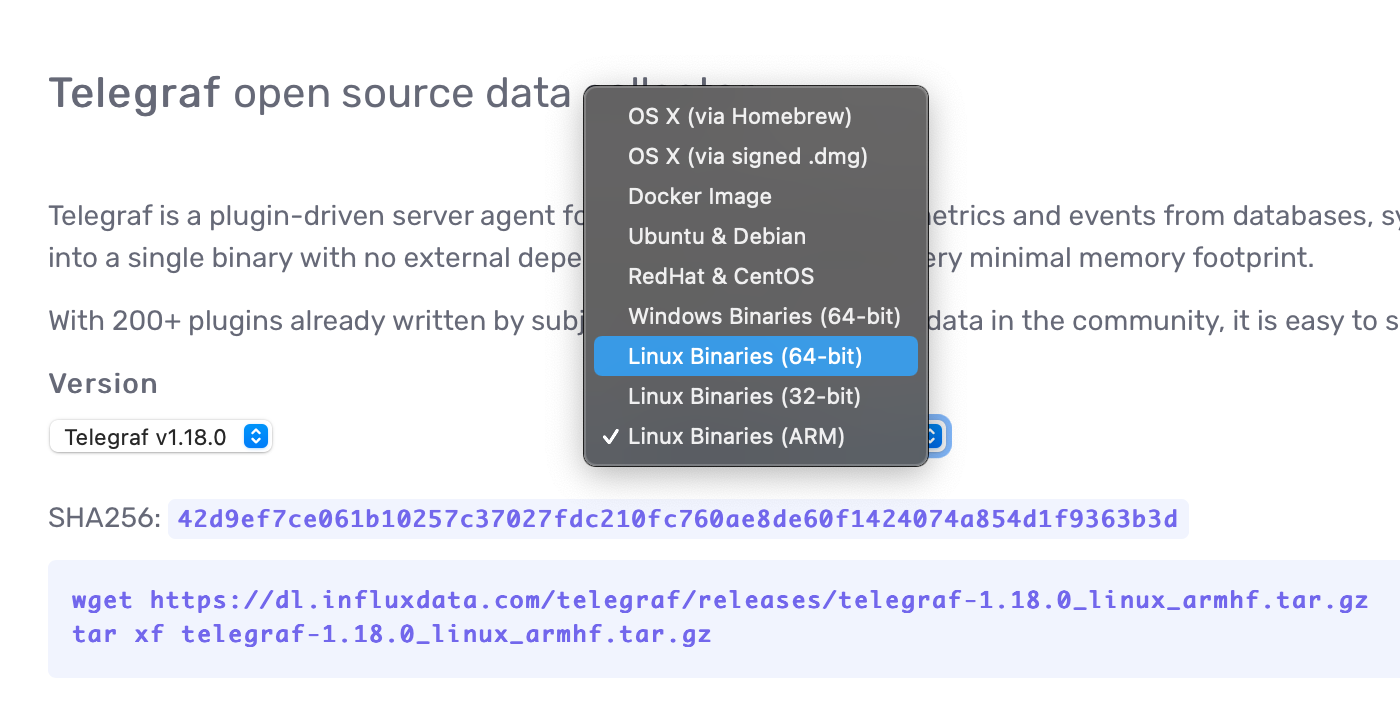
Installing on a ARM (Raspberry PI4)
shell # wget https://dl.influxdata.com/telegraf/releases/telegraf-1.18.0_linux_armhf.tar.gz
tar xf telegraf-1.18.0_linux_armhf.tar.gz

shell # cd telegraf-1.18.0

shell # mv usr/bin/telegraf /usr/bin/telegraf

shell # mv usr/lib/telegraf/scripts/telegraf.service /etc/systemd/system/telegraf.service

shell # systemctl daemon-reload

shell # mkdir /etc/telegraf
Step 3: Configure the Telegraf Agent
Configuration is same for both x86 and ARM based system.
shell # echo "INFLUX_TOKEN=<paste the token copied in Step-1>" > /etc/default/telegraf

shell # mv telegraf.toml /etc/telegraf/

shell # systemctl start telegraf.service
shell # systemctl status telegraf.service
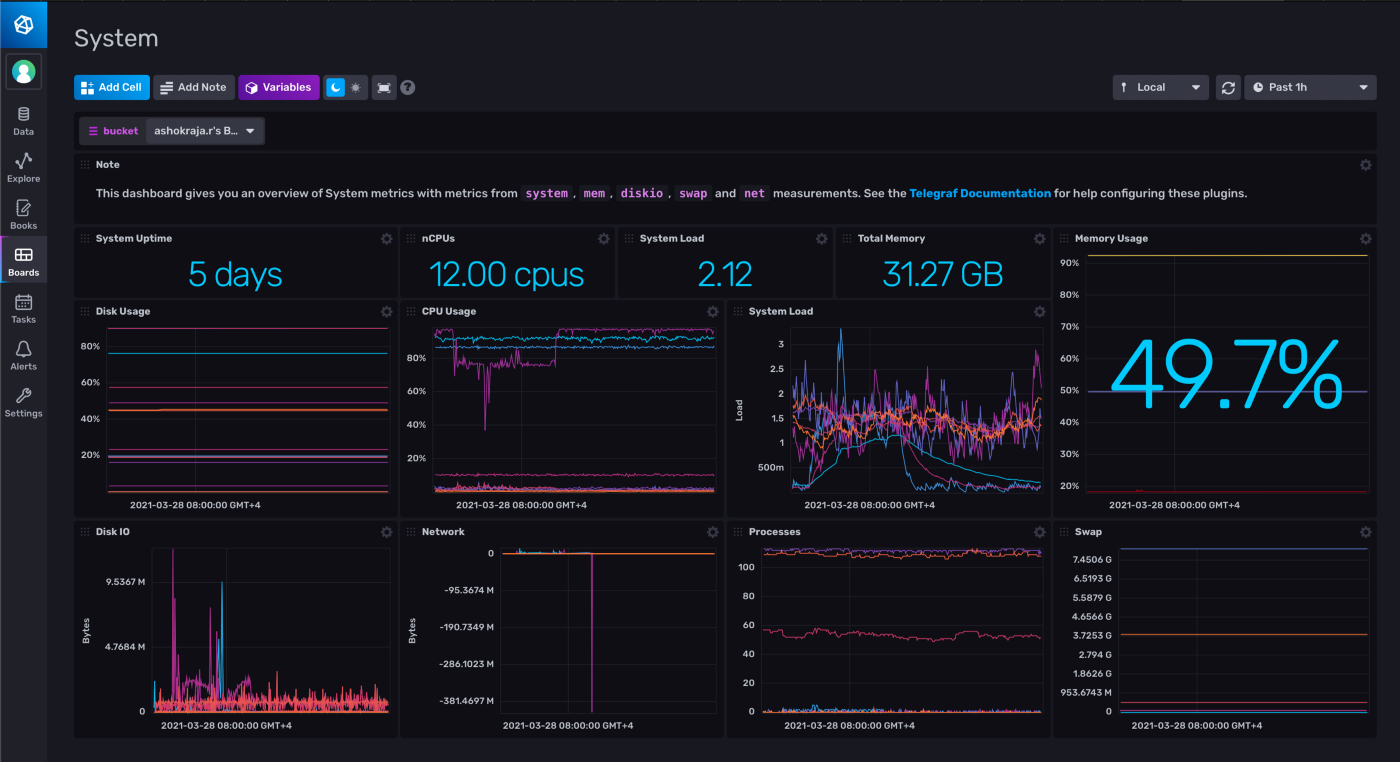
That’s it you should now see the metrics pouring in and there already a default System Dashboard setup for you already with some cool metrics to Observe.
Default System Dashboard created automatically